


No Pain, No Gain: Disciplined Investing through Anxious Times
Last year’s strong global equity performance followed on the heels of a decade-long bull market, underscoring how far the recovery has come from the depths of the financial crisis. However, it may also explain some investors’ fears that we may be closer to the beginning of the next stock-market downturn than we are to the next period of exceptional gains. The recent trend of moderating global economic activity and growth has been another source of anxiety, contributing to a sense of unease among investors. Here are some tips to continue practicing disciplined investing, even during the most anxious of times.
The Rebound Can Be Sharper Than the Decline
When downturns come to mind, investors are often fearful of bear markets—which are typically defined as declines of 20% or more in a broad stock market index (such as the S&P 500 Index or the Dow Jones Industrial Average).
No one likes to see the value of their investments decrease. But we know that ups and downs are a normal part of the investment cycle, even if recent market history suggests otherwise. And remaining disciplined within an appropriate investment strategy through a downturn—in order to fully participate in its eventual recovery—typically serves investors well.
Exhibit 1 shows the total returns of the global and U.S. stock markets in the one-year periods leading up to and following a bear-market bottom. This data suggest that rebounds are often bigger than declines by more than one-and-a-half times.
Exhibit 1: Stock-Market Performance Surrounding Bear Markets
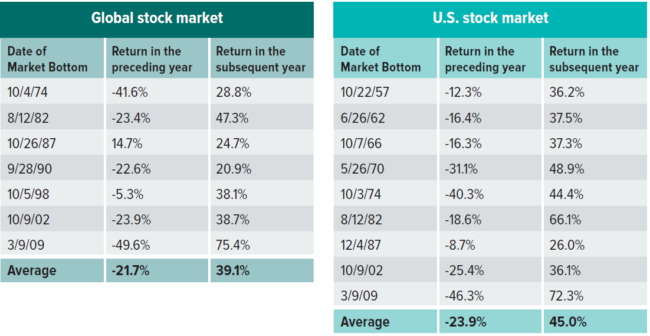
Global equity performance reflects returns of MSCI World (Gross) relative to historic market troughs surrounding seven bear markets since 1970 (based on the availability of daily data from January 1, 1970 through December 31, 2019). U.S. equity performance reflects returns of the S&P 500 Index surrounding nine bear markets since 1950 (based on the post-war period; daily data from January 1, 1950 through December 31, 2019). Bear markets defined as price declines of 20% or more. Source: Bloomberg, SEI. The S&P 500 Index launched on March 4, 1957. The MSCI World Index launched on Mar 31, 1986. All information for an index prior to its launch date is back-tested, based on the methodology that was in effect on the launch date. Back-tested performance, which is hypothetical and not actual performance is subject to inherent limitations because it reflects the application of an index methodology and selection of index constituents in hindsight. No theoretical approach can take into account all of the factors in the markets in general and the impact of decisions that might have been made during the actual operation of an index. Actual returns will differ from and may be lower than back-tested returns.
Based on the averages for global equities shown in Exhibit 1, if we combine the -21.7%decline and the 39.1% rebound, the net result was a gain of 8.9%, on a cumulative basis. Unsurprisingly, the returns leading up to a bear-market bottom were all negative, with one exception. Global equities still managed to eke out a positive return for the year leading up to the market bottom in October 1987. This was a result of global equities gaining as much as 50% before subsequently losing more than 20% in the months around the so-called Black Monday market crash on October 19, 1987. Excluding the somewhat anomalous bear market of 1987, the average experience across the six remaining bear markets for global equities still produces a positive net result.
In the U.S., where more historical data is available, the year leading up to the last nine market bottoms had an average decline of almost 24% and an average rebound of 45%, which combine for a net cumulative gain of 10.3%. Again, excluding 1987, the average net result was still positive. The significant decline in U.S. equities at the end of 2018 just barely missed qualifying as a bear market, but their performance in 2019 demonstrated that the rebound can be much stronger than the decline.
The Risk of Aiming Too Low Is That You May Hit Your Mark
Exhibit 2 illustrates two hypothetical portfolios. The first portfolio—let’s call this the baseline portfolio—is assumed to be aligned with an investor’s goals. The second portfolio—which we’ll call the under-risked portfolio—is a significantly de-risked version of the first. The baseline portfolio is intentionally generic and only acts as a basis for comparison for illustration purposes.
The only difference between the two portfolios is that 20% of the second portfolio’s riskier assets have been replaced by high-quality bonds (which are less risky). How might these portfolios fare in the years on either side of a bear market?
Exhibit 2: Two Hypothetical Portfolios
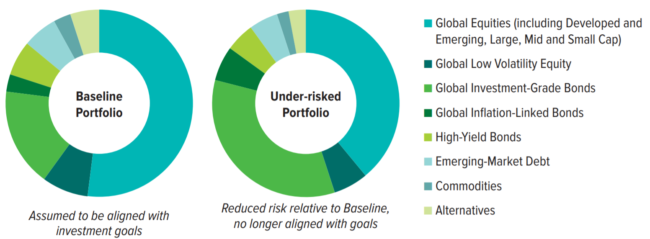
Baseline portfolio is a generic portfolio, arbitrarily chosen as a basis for comparison. The under-risked portfolio has investment-grade fixed income holdings (including global inflation-linked bonds) increased by 20%, at the expense of everything else, on a pro-rata basis. For purposes of stress testing, Global Equities=MSCI ACWI Investable Market Index; Global Low Volatility Equity=MSCI All Country World Minimum Volatility Index; Global Investment-Grade Bonds=Bloomberg Barclays Global Aggregate Bond Index; Global Inflation-Linked Bonds=Bloomberg Barclays World Government Inflation-Linked Bond Index; High Yield Bonds=ICE BofA US High Yield Master Constrained Index; Emerging Market Debt=50% JPMorgan EMBI Global Diversified Index and 50% JPMorgan GBI EM Global Diversified Index; Commodities=Bloomberg Commodity Index; Alternatives=HFRI Global Hedge Fund Index.
To answer this question, we ran stress tests on both portfolios. Using the modeling capabilities of a third-party risk-management system, we applied the average decline and the average rebound of global equities before and after bear markets (seen in Exhibit 1) as the “shocks,” or stress conditions, to estimate the performance of the portfolios.
The results, shown in Exhibit 3, are similar to what we’ve seen historically in the case of equity markets. The net cumulative effect (through decline and rebound) is estimated to be positive for both portfolios.
Exhibit 3: Stress-Test Results
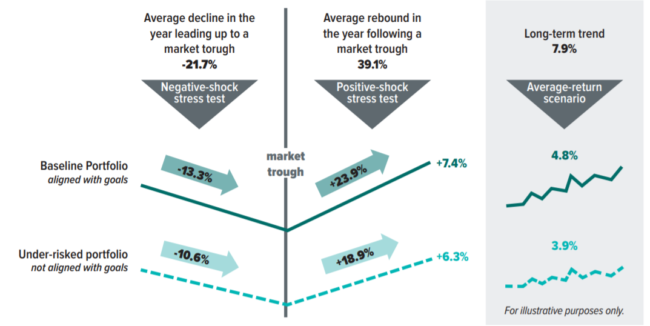
For illustrative purposes only. Estimated returns based on stress tests from BlackRock Portfolio Risk Tools using the hypothetical portfolios shown in Exhibit 2. Source: Bloomberg, SEI, BlackRock Portfolio Risk Tools. As of 1/7/2020. MSCI World data prior to 3/31/86 is back-tested.
While the under-risked portfolio did not experience as big a decline as the baseline portfolio, it also didn’t have as strong a rebound. Despite losing a bit more on the downside, the subsequent rebound in the baseline portfolio more than made up for the loss: It ultimately outpaced the under-risked portfolio by about 1%. Exhibit 3 shows the estimated gains of 7.4% for the baseline portfolio and 6.3% for the under-risked portfolio.
More importantly, the baseline portfolio represents the targeted return needed to meet the investor’s goals while remaining commensurate with their risk tolerance. The under-risked portfolio, representing an attempt to dodge a market downturn through more conservative positioning, would be expected to undershoot the investor’s goals.
This point is further illustrated by the longer-term trend numbers shown on the right side of Exhibit 3. Instead of using a large negative or large positive return as the shock for a stress test, we used the long-term average return (7.9%) as an input. The risk management system again estimated returns for the portfolios—4.8% and 3.9% for the baseline and under-risked portfolios, respectively. Based on these estimations, an under-risked investor may give up roughly 1% of expected return each year, which would potentially lead them off-track from their goals.
Keep Calm and Carry On
The ups and downs of the market, while sometimes stressful, are normal. No one knows exactly when they’ll happen or how long they’ll last. But our analysis shows that an under-risked portfolio that’s not aligned with investment goals may be less likely to see success over time.
As always, we continue to promote diversification and taking the minimum amount of risk possible while remaining aligned with investment goals. If a portfolio has become more concentrated and may, therefore, benefit from further diversification—or if an investor’s goals or risk tolerance have changed—then reviewing their asset allocation may be warranted.
But, unless there is a strategic reason to change course, it’s important to remember that accurately predicting major turning points in financial markets is near-impossible. Making significant changes to a portfolio solely on the basis of such predictions may be costly in the end (see here and here). Staying the course may help investors to avoid falling short of their goals.
Our analysis aims to reinforce the notion that keeping calm and remaining disciplined should produce better long-term investment results. Also, keep in mind that a well-diversified portfolio may soften the blow of a market downturn. It may not deliver outsized gains in up markets, but it may help to mitigate outsized losses in down markets, which should help investors stay on track to meet their goals.
Anxiety about market volatility is only natural. Yet most investors only focus on the downturn, without giving thought to the eventual rebound. If you’re having trouble sticking to your long-term plan, just remember that the rebound may be sharper than the decline.
Key Points:
- No one likes to see the value of their investments decrease. But we know that ups and downs are a normal part of the investment cycle, even if recent market history suggests otherwise.
- Our analysis aims to reinforce the notion that keeping calm and remaining disciplined should produce better long term investment results.
Index Definitions
The Bloomberg Commodity Index is a highly liquid and diversified benchmark for commodity investments.
The Bloomberg Barclays Global Aggregate Bond Index is an unmanaged market-capitalization-weighted benchmark that tracks the performance of investment-grade fixed-income securities denominated in 13 currencies. The Index reflects the reinvestment of all distributions and changes in market prices. The Bloomberg Barclays World Government Inflation-Linked Bond Index measures the performance ofvthe inflation-protected bond segment of the global bond market.
The HFRI Global Hedge Fund Index is designed to be representative of the overall composition of the hedge fund universe. It is comprised of all eligible hedge fund strategies; including but not limited to convertible arbitrage, distressed securities, equity hedge, equity market neutral, event driven, macro, merger arbitrage, and relative value arbitrage. The strategies are asset weighted based on the distribution of assets in the hedge fund industry.
The ICE BofA US High Yield Master Constrained Index contains all securities in the ICE BofA US High Yield Index but caps exposure to individual issuers at 2%. The ICE BofA US High Yield Index tracks the performance of below-investment grade, U.S. dollar-denominated corporate bonds publicly issued in the U.S. domestic market.
The JPMorgan EMBI Global Diversified Index tracks the performance of external debt instruments (including U.S.-dollar-denominated and other external-currency-denominated Brady bonds, loans, Eurobonds and local-market instruments) in the emerging markets.
The JPMorgan Government Bond Index-Emerging Markets (GBI-EM) Global Diversified Index is a comprehensive, global local emerging markets index, and consists of regularly traded, liquid fixed-rate, domestic currency government bonds to which international investors can gain exposure.
The MSCI World Index is a free float-adjusted market-capitalization-weighted index that is designed to measure the equity-market performance of developed markets. The Index consists of 24 developed-market country indexes.
The MSCI All Country World Investable Market Index captures large, mid and small cap representation across 23 Developed Markets (DM) and 26 Emerging Markets (EM) countries.
The MSCI All Country World Minimum Volatility Index aims to reflect the performance characteristics of a minimum-variance strategy, focused on providing absolute return and volatility with the lowest absolute risk. It is constructed from the MSCI World Index and the Barra Global Equity risk model and subject to the various constituent, country, sector, and factor constraints. The Index is unhedged and rebalanced (or re-optimized) semiannually.
The S&P 500 Index is an unmanaged, market-weighted index that consists of 500 of the largest publicly traded U.S. companies and is considered representative of the broad U.S. stock market.
Important Information
This material represents an assessment of the market environment at a specific point in time and is not intended to be a forecast of future events, or a guarantee of future results. This information should not be relied upon by the reader as research or investment advice and is intended for educational purposes only. Information contained herein that is based on external sources is believed to be reliable but is not
guaranteed by SEI Investments Management Corporation, and the information may be incomplete or may change without notice.
There are risks involved with investing, including loss of principal. Diversification may not protect against market risk. International investments may involve risk of capital loss from unfavorable fluctuation in currency values, from difference in generally accepted accounting principles or from economic or political instability in other nations.
Information provided by SEI Investments Management Corporation, a wholly owned subsidiary of SEI Investments Company.
Index returns are for illustrative purposes only and do not represent actual investment performance. Index returns do not reflect any management fees, transaction costs or expenses. Indexes are unmanaged and one cannot invest directly in an index. Past performance does not guarantee future results.
This is an article originally authored by Ryan Schneck and published in SEI’s Knowledge Center.
If you’re considering working with us here at Mosaic, we invite you to learn more about who we serve and how we help them. You can also contact us with any questions you have.
Securities and advisory services offered through Cetera Advisors LLC, Member FINRA/SIPC, a broker/dealer and a Registered Investment Advisor. Cetera is under separate ownership from any other named entity.